Overview
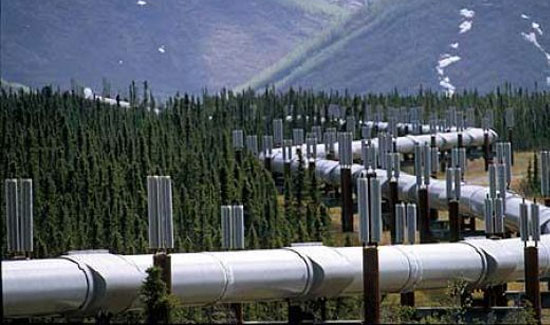
The oil and gas pipeline industry is responsible for constructing oil and gas pipelines, bulk storage tanks, oil refineries, pumping stations, mains and similar structures.
The industry is fairly fragmented with only one notable major player Fluor Canada Ltd who controls 9.6% of the market.
The oil and gas pipeline construction industry has shown strong growth from 2010-2015 with one of the primary drivers being Alberta oil sands production growth and the subsequent transportation of the bitumen to the Gulf Coast and Eastern Canada to be refined and processed. From 2010-2015, revenue grew at an annualized rate of 4.7% to $24.5 billion in 2015.
Current and future outlook
The advancement in shale drilling technology has allowed extraction of natural gas stored in shale rock. The increased gas production caused an increase in demand in pipelines, processing facilities and storage tanks necessary to bring the gas production to the market. However, industry revenue in 2015 is expected to decline up to 25% due to the uncertainty in the Keystone XL pipeline project being put on hold because of political opposition such as Obama vetoing of the pipeline proposal into the US.
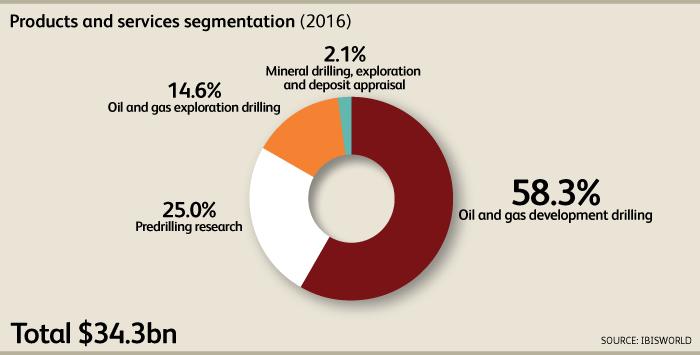
Product and services segmentation
The Canadian oil and gas pipeline construction industry earned $24.5 billion revenue in 2015 with anticipated annual growth of 3.7% from 2015-2020. The breakdown of the segmentation of the products is 25.7% oil transportation pipelines construction, 20.0% oil refineries consisting mainly of maintenance and upgrades, 18.0% gas distribution pipelines construction, 16.5% gas transportation pipelines, 11.4% natural gas processing plants, and 0.6% pumping stations as illustrated in the pie chart below.
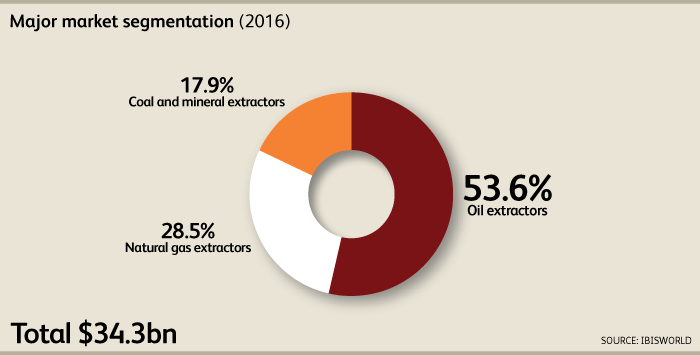
Major market segmentation
The breakdown of the major market segmentation for 2015 is 49.4% oil and 50.6% natural gas of the $24.5 billion 2015 revenue is shown below.
External Drivers
The important external drivers that affect the oil and gas pipeline construction industry.
Nonresidential construction: As the value of nonresidential construction increases, infrastructure investment into pipelines, oil and gas projects also increased. In 2015, nonresidential construction increased.
Global crude oil prices: As crude oil prices increases especially beyond $100 USD/barrel, the demand for infrastructure and oil pipeline construction increases as the incentive to expand operations and increase profit increases. In contrast, the fall of crude oil to under $40 USD/barrel at the end of 2015 has hindered infrastructure investments.
Global natural gas price: When natural gas price increases, downstream operators expand operations by outsourcing to build pipelines and storage tanks to this industry. As the price of natural gas decreases, construction activities of pipelines and storage tanks decrease. In 2015, natural gas price has decreased.
Overnight rate: The overnight rate is the rate that financial institutions charge to lend money to each other which is set by the Bank of Canada targeted interest rate. The interest rate has decreased in 2015 from 1% to 0.5% offering low cost financing which the oil and gas pipeline construction industry can take advantage of. However, the volatility of prices in the commodity has caused havoc in corporate bonds linked to commodities especially to crude oil and natural gas companies with some reaching junk bond status which further increases the rate of borrowing due to the financial risk of increased bankruptcy.
Global steel prices: The primary input for constructing pipelines found in oil and gas construction is steel. As the price of steel increased, the input prices for the project increases which puts pressure on profit margins as not all cost increases can be passed down to the buyer. As the price of steel decreases, the input prices decrease which increase profit margin. In 2015, the global price of steel priced as demand for steel decreased due to the slowdown in the global economy especially China.
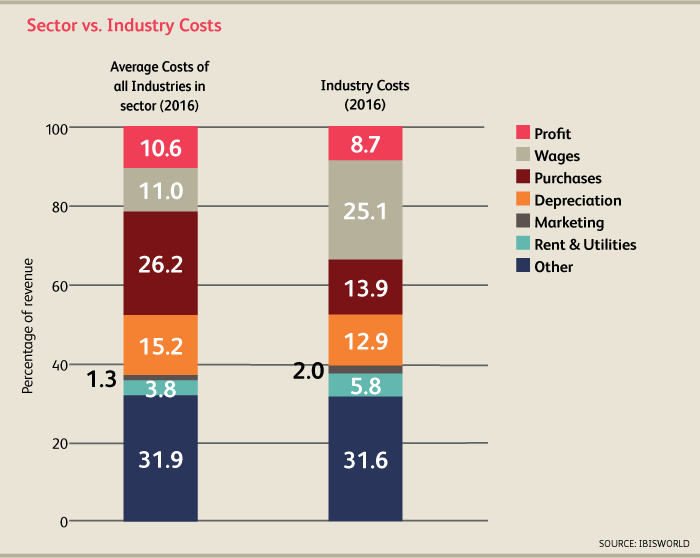
Industry cost structure breakdown
Profit: Profit has increased to 8.0% in 2015 as the demand for pipeline construction increased combined with falling raw material and steel prices.
Wages: Pipeline construction requires specialized skilled labor which comes at a premium requiring contractors, engineers and project managers. This increase in labor costs explains the 31.9% of revenue paid out as wages.
Purchases: Purchasing cost accounts for 21.5% of 2015 revenue as generators, pipelines, pumps, steel sheets, valves and other components have to be acquired. In 2015, purchasing costs decreased due to the primary steel materials falling in prices globally.
Depreciation: Depreciation made up of 10.1% of revenue and on a declining trend due to less capital asset investments into purchasing trucks, machines, forklifts, drills, hydraulic bending, and other heavy machinery.
Rent and Utilities: They make up 5.8% of costs due to the rental of machinery of companies that can’t afford to buy it outright or with favorable financing and heavily machinery requires high energy costs to operate.