Industry overview
Operators in the billboard and outdoor advertising industry create, design and place physical advertisements which are printed, painted or on electronic displays on billboards, panels, on and within physical structures, and on and within transit vehicles. Revenue in 2015 is expected to be $1.1 billion with annual growth rate in the past five years of 0.2%. As corporate profits increase, more money is allocated to advertising.
In 2015, the decline in crude oil prices dampened corporate profits and increased billboard vacancy which increased competition and put a cap in industry prices and indirectly industry revenue and profits. The ability of outdoor advertising to capture a broad audience has allowed companies to charge a premium price and escaped the fate of traditional media such as newspapers. The vast expansion of online media has driven down prices for online advertising despite the internet’s ability to reach a broad audience as the market is fragmented into millions of websites and portals with each one only reaching a segment of the market demographic.
Technological changes in the billboard space with the invention of digital billboards have allowed advertisers to change their message at a moment’s notice and expanded the ability of advertisers to target different audiences at different times of the day with a different message that caters to the specific demographic. This has allowed companies in the billboard space to charge advertisers a premium for this service with industry operators earning an above average industry return for their investment in digital billboards. This has fueled industry consolidation of large players who wish to build a vast digital network to attract the largest corporations who wish to reach a very broad audience in a targeted way.
2015 Industry product segmentation revenue
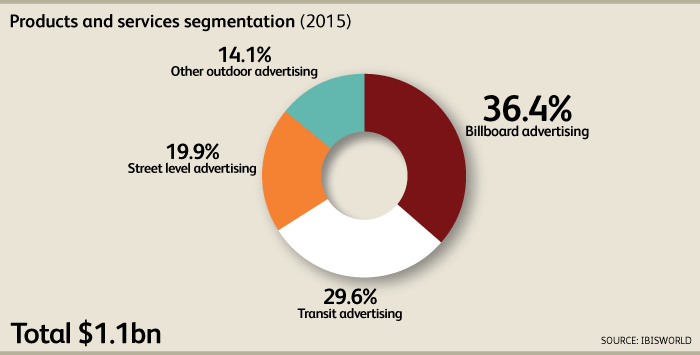
Billboard advertising ad space sales of bulletin and posters with an advertising campaign duration ranging from a few months to exceeding ten years accounted for 36.4% of industry revenue. Ad space prices are based on exposure and audience number who view the advertisement.
Transit advertising includes interior or exterior advertising on transportation systems including airports, buses, railway stations, subways, trains and trams and accounted for 29.6% of industry revenue. Contracts to market transit advertising for these private and public property owners are based on an open bidding process.
Street level advertising includes benches, information kiosks, washrooms, and transit bus shelters which make up 19.9% of industry revenue. Contracts are obtained via an open bidding process with contract duration sometimes over a decade where the property owner and local government share in the advertising revenue. Often, industry operators install and maintain these structures which they own.
Other outdoor advertising includes mall displays, murals on sides of building, and spectaculars special effects make up 14.1% of industry revenue. These forms of advertising have a limited market due to the associated high cost.
2015 Market segmentation
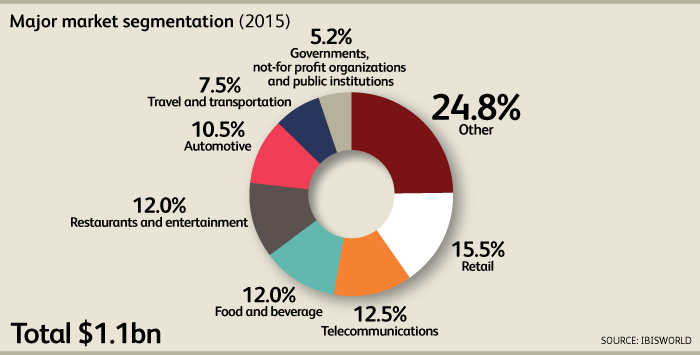
Retail including downstream stores makes up 15.5% of market revenue is susceptible to economic cycles including the job market due to being dependent on per capital disposable income consumer spending. Businesses decrease market spending due to a reduction in revenue when consumers have less disposable income to spend. The future outlook remains relatively stable.
Telecommunications make up 12.5% of market revenue and the marketing budget of these advertisers is expected to increase as mobile phones and tablets continue to penetrate the consumer market.
Food and beverage make up 12.0% of market revenue and includes concession food such as candy bars and soft drinks. This segment has a stable outlook.
Restaurant and entertainment make up 12.0% of market revenue and is dependent on the labor market and per capital disposable income. As the economy stagnates and goes into recession, consumer spending decreases which positively correlates with decreases in restaurant and entertainment market spending.
Travel and transportation make up 7.5% of market revenue and includes discretionary and travel services which are not directly correlated with per capital disposable income and the labor market.
Industry structure

Profit has increased from 5.6% in 2012 to 11.0% in 2015 as percentage of revenue. In 2012, advertisers were reluctant to spending advertising dollars after coming out of a recession. Industry competitors competed on price and decreased ad rates which drove down profits. Profits have since increased as the economy improved, consumer spending stabilized and ad rates have rebounded to a healthy level.
Wages make up 23.1% of 2015 industry revenue and are expected to decrease as less labor intensive digital advertising replaces more labor intensive display advertising.
Purchases make up 22.8% of industry revenue as fees have to be paid to property owners, government, businesses, and transit operators to display the advertising since the display advertising company does not own the building, land or the transit system.
Depreciation makes up 9.3% of industry revenue as operators have to adhere to strict maintenance requirement of the advertising property. Moreover, the useful life of a display advertising billboard is fifteen years but is shorten by unusual wealth and vandalism.
Rent and utilities makes up 18.3% of industry revenue. Rent of advertising billboard space is dependent on market competition, location and visibility as the exclusive display advertiser of the space is determined via a tender process.